데이터가 곧 자산인 시대, 데이터를 처리하고 분석하는 능력은 필수 스킬로 자리 잡았습니다.
그중에서도 파이썬(Python)은 간결한 문법과 방대한 라이브러리로 데이터 분석에 가장 적합한 프로그래밍 언어로 평가받고 있습니다.
이번 글에서는 파이썬을 사용해 데이터를 처리하고 분석하는 방법을 소개합니다.
초보자도 쉽게 따라 할 수 있는 단계별 가이드를 통해 데이터 분석의 기초를 익혀보세요!
[엔카코]
이론 [ 파이썬 기본 문법, 데이터 구조, 넘파이와 판다스 라이브러리 ]
◼ 파이썬 기본 문법
- 변수와 자료형 : 파이썬은 숫자, 문자열, 리스트, 딕셔너리 등 다양한 자료형을 지원합니다.
- 제어문 : 조건문과 반복문으로 로직을 제어할 수 있습니다.
name = "Alice"
age = 25
scores = [85, 90, 88]

for score in scores:
    if score > 80:
        print(f"Great score: {score}")
◼ numpy 설치
Windows에서 numpy를 설치하려면 pip라는 패키지 관리 도구를 사용합니다.
1. 명령 프롬프트 열기
- Windows에서 cmd 또는 명령 프롬프트를 검색하여 실행합니다.
2. numpy 설치
- 명령 프롬프트에서 아래 명령어를 입력하여 numpy를 설치합니다.
pip install numpy3. 설치 확인
- 설치가 완료되면 numpy가 올바르게 설치되었는지 확인하려면 아래 명령어를 입력하여 numpy 버전을 확인합니다.
python -c "import numpy; print(numpy.__version__)"4. NumPy (배열 연산에 강력한 도구) : 다차원 배열 생성 및 수학적 연산
import numpy as np

data = np.array([1, 2, 3, 4])
print("배열:", data)
print("배열의 평균:", data.mean())
◼ pandas 설치
pandas는 Python의 데이터 분석 라이브러리로, 데이터를 효율적으로 다룰 수 있는 다양한 기능을 제공합니다.
pip 명령어를 사용하여 설치할 수 있습니다.
1. 명령 프롬프트 열기
- Windows에서 명령 프롬프트를 열기 위해 cmd를 검색한 후 실행합니다.
2. pandas 설치
- 명령 프롬프트에서 아래 명령어를 입력하여 pandas를 설치합니다.
pip install pandas
3. 설치 확인
- 설치가 완료된 후, pandas가 제대로 설치되었는지 확인하려면 아래 명령어를 입력합니다.
python -c "import pandas; print(pandas.__version__)"
4. Pandas (데이터프레임으로 데이터 조작) : CSV 파일 불러오기와 데이터 처리
import pandas as pd

# CSV 파일 읽기
df = pd.read_csv("data.csv")

# 상위 5개 데이터 출력
print(df.head())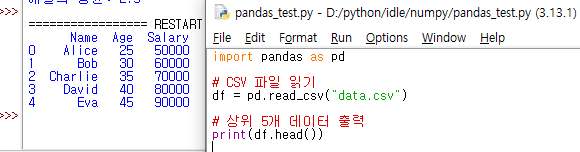
실습 [ 데이터 처리 및 분석 실습 ]
◼ csv 파일 읽기 및 데이터 처리
import pandas as pd

# 가상의 데이터셋 생성
data = {
    'Name': ['Alice', 'Bob', 'Charlie', 'David', 'Eva'],
    'Age': [25, 30, 35, 40, 45],
    'Salary': [50000, 60000, 70000, 80000, 90000],
    'Date of Joining': ['2020-01-15', '2019-05-12', '2021-03-20', '2018-11-03', '2022-08-09']
}

# DataFrame 생성
df = pd.DataFrame(data)

# CSV 파일로 저장
df.to_csv('employee_data.csv', index=False)
- 데이터 정리 및 변환 [ 결측치 처리, 문자열 데이터 처리, 날짜 데이터 처리 ]
- 데이터 집계 및 통계 요약 [ 기본 통계 요약, 연도별 평균 연봉 ]
import pandas as pd
# pandas를 사용해 CSV 파일 읽기
df = pd.read_csv('employee_data.csv')
# 로우 데이터 확인
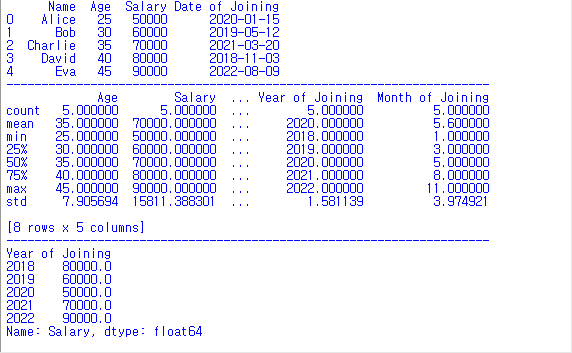
print(df)
# 구분선
print("---------------------------------------------------------------------")
# 결측치 처리 (inplace=True 대신 직접 할당)
# 만약 Salary에 결측치가 있을 경우, 이를 평균값으로 채우는 예시입니다.
df['Salary'] = df['Salary'].fillna(df['Salary'].mean())
# 문자열 데이터 처리
# 이름(Name) 컬럼에서 첫 글자만 대문자로 바꾸는 작업을 합니다.
df['Name'] = df['Name'].str.capitalize()
# 날짜 데이터 처리
# Date of Joining 컬럼을 날짜 형식으로 변환하고, 이를 이용해 연도 및 월을 추출합니다.
df['Date of Joining'] = pd.to_datetime(df['Date of Joining'])
df['Year of Joining'] = df['Date of Joining'].dt.year
df['Month of Joining'] = df['Date of Joining'].dt.month
# 기본 통계 요약
# describe()를 사용하여 기본적인 통계 요약을 확인할 수 있습니다.
print(df.describe())
# 구분선
print("---------------------------------------------------------------------")
# 연도별 평균 연봉
# 연도별로 평균 연봉을 계산해볼 수 있습니다.
salary_by_year = df.groupby('Year of Joining')['Salary'].mean()
print(salary_by_year)
◼ 출력값
◼ 데이터 시각화
- matplotlib을 사용하여 연령대별 연봉을 시각화합니다.
- matplotlib 설치
pip install matplotlib
- 연령대별 평균 연봉 데이터를 시각화하는 예제를 작성해 보았어요.
import matplotlib.pyplot as plt

# 연령대별 평균 연봉 시각화
plt.figure(figsize=(8, 6))
plt.bar(df['Age'], df['Salary'], color='skyblue')
plt.xlabel('Age')
plt.ylabel('Salary')
plt.title('Age vs Salary')
plt.show()
- seaborn을 사용하여 Salary와 Age 간의 관계를 시각화합니다.
- seaborn 설치
pip install seaborn
import matplotlib.pyplot as plt
import seaborn as sns
import pandas as pd

# pandas를 사용해 CSV 파일 읽기
df = pd.read_csv('employee_data.csv')

# Salary와 Age의 관계를 시각화
sns.scatterplot(x='Age', y='Salary', data=df)
plt.title('Age vs Salary')
plt.show()
프로젝트 [ 실제 데이터셋을 활용한 데이터 분석 보고서 작성 ]
- 마지막으로 Kaggle 또는 공공 데이터 포털에서 데이터를 가져와 분석 프로젝트를 진행해 보세요.
- 데이터셋: 소상공인시장진흥공단_상가(상권)정보
- 목표1: 부산에서 상가의 업종별 분포와 상위 10개의 업종을 수치화하여 시각화하기.
- 목표2: 부산에서 운영되는 카페의 밀집도를 행정동별로 수치화하여 시각화하기.
- 사용 도구: Python, NumPy, Pandas, Matplotlib
pip install chardetimport pandas as pd
import matplotlib.pyplot as plt
import matplotlib.font_manager as fm
import seaborn as sns
# 폰트 경로 설정 (예: 윈도우의 "맑은 고딕" 폰트)
font_path = "C:/Windows/Fonts/malgun.ttf"
font_prop = fm.FontProperties(fname=font_path)
# 폰트 설정 적용
plt.rc('font', family=font_prop.get_name())
# 파일 로드 (low_memory 사용)
file_path = r"소상공인시장진흥공단_상가(상권)정보_부산_202409.csv"
df = pd.read_csv(file_path, encoding='UTF-8', low_memory=False)
# 분석에 불필요한 열 제거
df = df.drop(['지점명', '동정보', '호정보'], axis=1)
# 결측치가 많은 열 중 일부 채우기 (예: 층정보를 "알 수 없음"으로 채움)
df['층정보'] = df['층정보'].fillna('알 수 없음')
# 기본적인 결측치 처리
df = df.dropna(subset=['상호명', '위도', '경도']) # 상호명과 위치 정보가 없는 데이터 제거
# 업종별 데이터 개수 확인
industry_count = df['상권업종대분류명'].value_counts()
# 상위 10개 업종 시각화
plt.figure(figsize=(10, 6))
sns.barplot(
x=industry_count.values[:10],
y=industry_count.index[:10],
palette='viridis',
hue=industry_count.index[:10], # `hue`에 y 값을 할당
legend=False # 필요에 따라 추가
)
plt.title('부산 지역 상가 업종별 분포 (상위 10개)')
plt.xlabel('상가 수')
plt.ylabel('업종')
plt.show()
pip install folium
pip install geopandas
import pandas as pd
import folium
import matplotlib.font_manager as fm
from branca.colormap import linear
from folium.features import DivIcon
# 폰트 경로 설정 (예: 윈도우의 "맑은 고딕" 폰트)
font_path = "C:/Windows/Fonts/malgun.ttf"
font_prop = fm.FontProperties(fname=font_path)
# 파일 로드
file_path = r"소상공인시장진흥공단_상가(상권)정보_부산_202409.csv"
df = pd.read_csv(file_path, encoding='UTF-8', low_memory=False)
# 데이터 필터링: 화과자 공방 업종 (I56221)
df_filtered = df[df['표준산업분류코드'] == 'I56221']
# 결측치 처리: 위도, 경도 데이터가 있는 업소만 사용
df_filtered = df_filtered.dropna(subset=['위도', '경도', '행정동명'])
# 행정동별 업소 밀집도 계산
dong_count = df_filtered.groupby('행정동명').size().reset_index(name='업소수')
# 행정동별 위도, 경도 정보 추가
dong_coords = df_filtered.groupby('행정동명')[['위도', '경도']].mean().reset_index()
# 행정동별 업소 수와 좌표 병합
dong_data = pd.merge(dong_count, dong_coords, on='행정동명')
# 부산의 기본 지도 생성 (위도, 경도)
map_busan = folium.Map(location=[35.1796, 129.0756], zoom_start=12)
# 업소 수에 따른 색상 맵핑 (푸른색~붉은색 계열, 색상 반전)
colormap = linear.RdYlBu_09.scale(dong_data['업소수'].min(), dong_data['업소수'].max()) # 색상 반전
# 행정동별로 색상 적용 및 업소수 표시
for _, row in dong_data.iterrows():
dong_name = row['행정동명']
location = [row['위도'], row['경도']]
업소수 = row['업소수']
# 동그라미로 업소 밀집도 시각화
folium.CircleMarker(
location=location,
radius=20, # 반지름 크기
color=colormap(row['업소수']),
fill=True,
fill_color=colormap(row['업소수']),
fill_opacity=0.6,
popup=f"동: {dong_name}\n업소수: {업소수}",
tooltip=dong_name # 마우스를 올려놓으면 행정동 이름이 표시됨
).add_to(map_busan)
# 동그라미 중앙에 업소 수 숫자 표시
folium.Marker(
location=location,
icon=DivIcon(
icon_size=(30, 30), # 크기 설정
icon_anchor=(15, 15),
html=f'<div style="font-size: 12px; color: black; text-align: center;">{업소수}</div>'
)
).add_to(map_busan)
# 색상 바 추가
colormap.add_to(map_busan)
# 지도 파일로 저장
map_busan.save("busan_cake_shop_density_map_dong_with_boundary_and_popup.html")
print("행정동명 별 밀집도 지도 (업소 수 및 업체 목록 표시) 저장 완료!")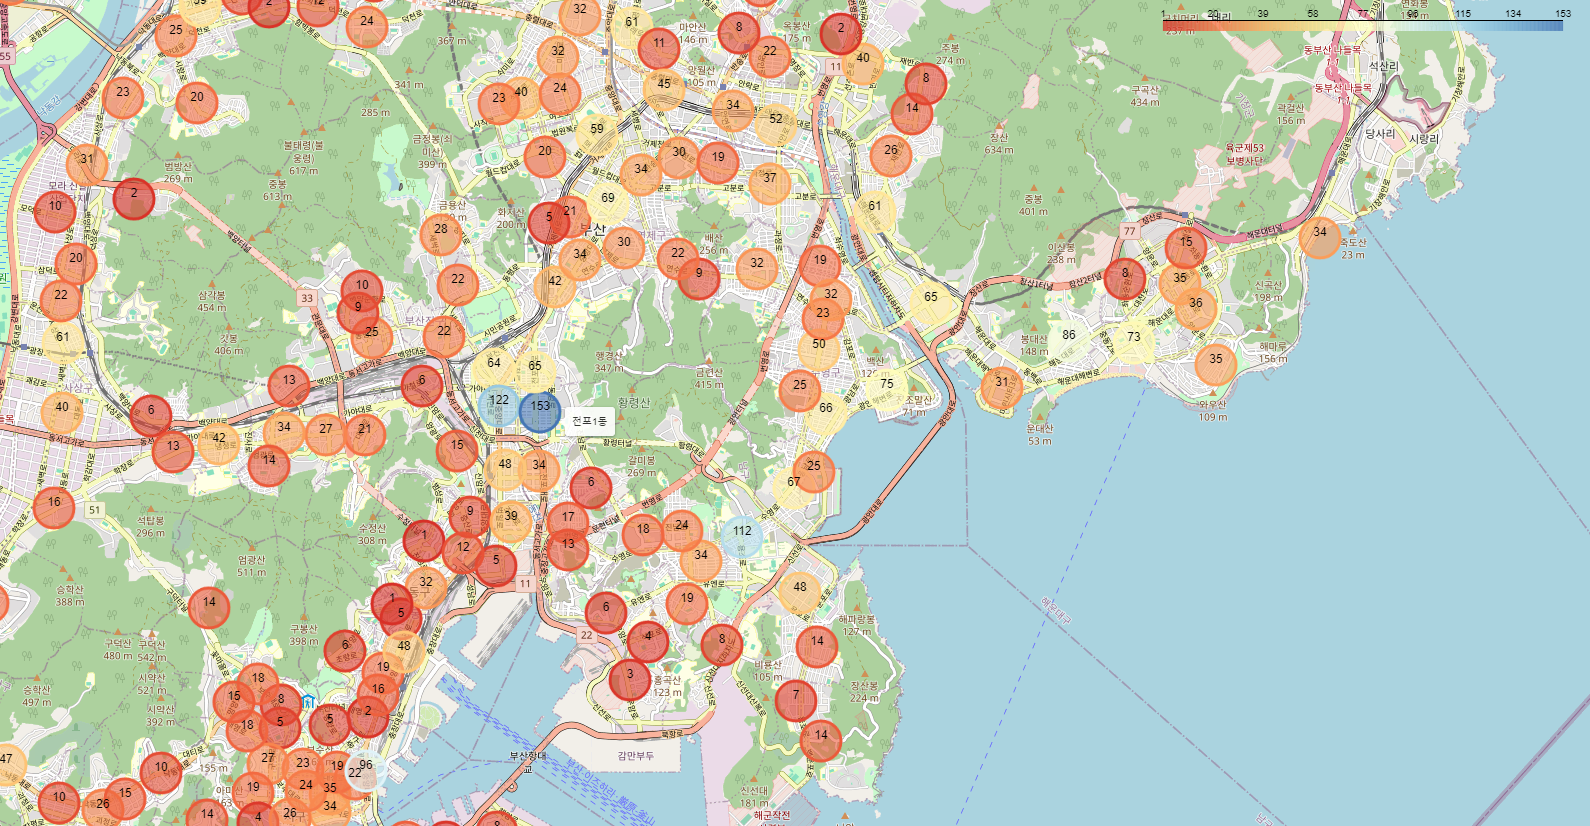
※ 저는 목표를 설정하고 결과에 도달하기 위해서 다양한 방식 중 AI를 주로 사용하였습니다. 재가 과거 수작업으로 개발할 때 보다 지금이 아주 간편하고 시간도 절약되는 게 너무 신기하고 경각심이 들었습니다. ChatGPT를 활용하여 python 개발을 수행할 수 있습니다. 허나, 결과는 AI 가 선택하는 것 아니고, 인간이 선택하는 것입니다. 현명한 선택을 할 수 있도록 다양한 방면에서 지식을 배워야 하는 것을 명심해야겠습니다.
이번 실습을 통해 CSV 파일을 읽고 데이터 처리, 변환, 집계하는 방법을 익혔습니다. 또한, Matplotlib 과 Seaborn을 활용하여 데이터를 시각화하고 중요한 인사이트를 도출하는 방법을 배웠습니다. 실습을 통해 데이터 분석의 기초부터 심화까지 다양한 기법을 경험해 보세요.

1. 인공지능 기초와 아이디어
1. 이론 [ 인공지능의 정의, 역사, 머신러닝과 딥러닝 개념 ]인공지능의 정의📝인공지능(AI)은 인간의 지능을 모방하여 학습, 문제 해결, 패턴 인식 등을 수행하는 컴퓨터 시스템을 말합니다.인공
ncaco97.tistory.com
3. 머신러닝 기초
머신러닝은 데이터를 분석하고 학습하여 예측이나 분류를 수행하는 인공지능 기술의 핵심 요소입니다. 이 글에서는 머신러닝의 기초 개념을 이해하고, 실습을 통해 기본적인 머신러닝 모델을
ncaco97.tistory.com
'전문성은 무엇으로 만들어지는가 🎓 > 이론과 실습으로 배우는 AI 입문 🤖' 카테고리의 다른 글
| 5. 컴퓨터 비전 (5) | 2025.02.04 |
|---|---|
| 4. 딥러닝 입문 (1) | 2025.01.14 |
| 3. 머신러닝 기초 (5) | 2025.01.05 |
| 1. 인공지능 기초와 아이디어 (3) | 2024.12.09 |
| 0. 인공지능 입문 커리큘럼 작성하기 (9) | 2024.12.03 |


